
This post covers trail camera batteries, introduced in Trail Camera Batteries: Internal AA-Cell Options in greater technical detail. It includes more detail on the Li-ion AA batteries, a description of methods I used to obtain the data, battery capacity metrics, and spreadsheet models I used to do a quantitative lifetime cost estimate of primary and rechargeable AA batteries under different operating conditions.
Li-ion AA cells: New Kid on the Block
In 2019 several vendors introduced a AA-compatible battery based on the same rechargeable Lithium-ion (Li-ion) technology used in smart phones and laptops. Since Li-ion cells have a cell voltage of 3.7 V (not 1.5, per AA standard), these “batteries” actually also include a tiny voltage converter and charge controller inside the AA form factor, along with a lithium-ion battery. See References below for a great video showing how this is all packed into the steel battery tube.
Marketing “Constant Voltage”
The “constant 1.5 Volt” output claim made by at least one vendor is true, but mostly irrelevant. Modern devices, including trail cameras, have their own internal voltage converters capable of operating over a range of input voltages. On the other hand, this “feature” absolutely prevents the camera from estimating state of charge based on battery voltage, since it never changes until the battery is dead! If you use these batteries, ignore the camera’s battery meter.
Reliability
From a system perspective, these batteries introduce 8 more independent power converters, and therefore 8 new single points of failure. The technology in these power converters is solid state, and well-established, but their reliability and durability over time and temperature variation depends on the choice of materials and workmanship of the manufacturer. Longevity is both key to the value of rechargeable cells, and something which may not become apparent for months or years.
Update 2022-01-01: I have been using TenaVolt branded LiIon AA batteries for a few months now to power the SB28 flashes in our homebrew sets. While charging a group of four recently, I noticed that the blue charging ring LED on one of the cells had stopped working. Hoping that it was just a problem with the light itself, I left it in the charger with other working cells to charge. Unfortunately, when I went to use it, I found that this cell was dead (0 Volts). This does not bode well for the durability of these particular Li-ion AA batteries.
Bottom Line
Unknowns aside, the advantages of the Li-ion AA cells are compelling. These batteries keep their charge for a long time, have good behavior at low temperature, and are 100% AA voltage compatible. These are improvements over NiMH rechargeable cells. Even at a cost of nearly $10USD/cell, these batteries can be more economical and than LiFeS2 cells. I’ll cover these cases later in the post.
Update 2022-02-24: I have now had 3 failures out of a set of 8 TenaVolts Li-ion AA batteries. As I feared, the integrated charge controller failed in each of these. I used these batteries to power SB-28 flashes, not trail cameras. The flashes may have a higher current draw than trail cameras, which could have put more stress on the power converters. Still, based on this experience, I cannot recommend these batteries.
Methods
To get the video capacity and SD card usage of each battery type, under different conditions, I could have put the batteries in trail cameras and measured them to exhaustion under different conditions. Arguably, this would be the most accurate method. Instead, I measured the current (and from there calculated the power) consumed by the BTC-7A under different operating conditions. For example, while taking illuminated (466 mA at 13.2 Volts, or 6.15 Watts) and non-illuminated videos (180 mA at 13.2 Volts or 2.28 Watts).
I then used a battery discharge tester (see references) to measure the capacity of different battery types under different loads and at different temperatures. I took averages over 4-cells. The batteries (including rechargeable) were all new to start.
I then used a spreadsheet to marry this data together into the graphs produced for this post. If you’d like a copy of my spreadsheet to create results for your camera, please request in comments below (sorry — WordPress won’t let me link to excel documents).
Battery Capacity Metrics
Battery capacity has traditionally been measured in Amp-hours (or, more often, milli-Amp-hours). This capacity as the product of current from the battery and time. Thus, a battery with a 2500 mAh capacity should provide (in principle) 2500 mA for an hour; 250 ma for 10 hours, 25mA for 100 hours, etc. This metric makes sense in devices whose function requires a certain current, in the range of voltages of a typical battery discharge.
Unfortunately, this metric is not the best for modern electronic devices (like trail cameras), which use electronic power converters to efficiently extract some constant low voltage from batteries at varying power by changing the amount of current consumed from the higher voltage battery pack. Nor is this metric appropriate for comparing batteries with significantly different voltages (e.g. NiMH and LiFeS2). For both of these reasons, I use Watt-hours, a unit of energy, to describe battery capacity in this post.
A Watt-hour is the product of the power consumed and time. Thus, a 4.5 Wh battery can (in principle) provide 4.5 Watts for 1 hours, 450 mW for 10 hours, and 45 mW for 100 hours. Power is, in turn, the product of voltage and current. Thus, 1 Ampere at 1 Volt is 1 Watt.
One can convert battery capacity in mAh to Wh by multiplying the mAh capacity of the battery by it’s average discharge voltage and dividing by 1000. Thus, a 2500 mAh NiMH cell with an average discharge voltage of 1.2 Volts has an energy capacity of 3.0 Wh. In contrast, a Li-ion rechargeable cell with a capacity of 2500 mAh and an average discharge voltage of 1.5 Volts would have a significantly larger energy capacity of 3.75 Wh.
Lifetime Cost Model for Primary vs. Rechargeable Cells
I wanted to compare the primary vs. rechargeable batteries based on their lifetime costs. Because the results of such a comparison depend on the quantitative parameters of the batteries, as well as the trail camera deployment model, I built a spreadsheet model which takes into account the factors in the table below.
Model Parameters
| Model Parameter | LiFeS2 Primary | Li-ion AA Rechargeable | Alkaline Primary | NiMH Rechargeable |
| Battery Cost (per cell): $USD | $1.60 | $9.95 | $0.68 | $3.25 |
| Battery Capacity (22C/72F): Wh | 5.3 | 2.5 | 3.4 | 2.2 |
| Power for daylight Video (W) | 2.38 | <- | <- | -< |
| Power for nightime Video (W) | 6.15 | <- | <- | <- |
| Fraction of Video at Night | 0.20 | <- | <- | <- |
| Number of Batteries in Camera | 8 | <- | <- | <- |
| Camera/Battery Lifetime (Years) | 5 | <- | <- | <- |
Note that I assume temperature is not a factor in these comparisons. As we have seen, this is not the case for alkaline cells.
Most commercial trail cameras rely on a set of AA batteries. These are often in a removable carrier, for easy access and replacement. Different cameras require different numbers of these batteries, but the typical configuration is 8 AA batteries (although some use 6 and others 12). For this model, I will assume an 8-battery pack when projecting battery costs and lifetimes.
Battery Operating Lifetime
Note that I assume a battery lifetime of 5 years. This works against the major benefit of rechargeable cells, since it limits the number of times the cell can be reused before it needs to be replaced. Although both NiMH batteries (rated for “several hundred” charge cycles) and Li-ion batteries (rated for several thousand charge cycles) provide more than enough charge cycles for even the most demanding service intervals and activity rates likely to be seen for trail camera deployments, the lifetime of these batteries may be limited, independent of charge/discharge cycles. Battery manufacturers typically list 5 years as the service life for both Li-ion and NiMH chemistries.
Critical Parameters
After some poking around with the model and parameters, it became clear that the tradeoff in costs between using primary cells vs. (the more expensive) rechargeable cells depends primarily on two factors:
- How often the batteries are replace, which I’ll call the Service Interval. In the plots below, I vary the time between checking/replacing batteries from 1 to 12 months.
- How active the set is, which I’ll call the Activity Intensity. This is the typical rate at which video is captured, measured in hours of video per month. In the plots below, I vary the amount of video taken per month between half an hour (typical with “animal only” triggers at a “good set”), and 6 hours per month (typical of a very busy, or false-trigger prone set)
On one extreme, primary cells are most appropriate and cost-effective in sets which are serviced rarely, and have a relatively small rate of video/photo capture. Conversely, rechargeable cells are better suited to sets which are serviced frequently and which accrue videos/photos at a high rate.
I assume video as the operating mode, as it tends to more energy intensive than photos, and use of video (with photos captured from outtakes) is growing in popularity. From a power perspective, using a camera in photo only mode can be approximated by equating 1 photo to one second of video.
Model Results: LiFeS2 vs. Li-ion
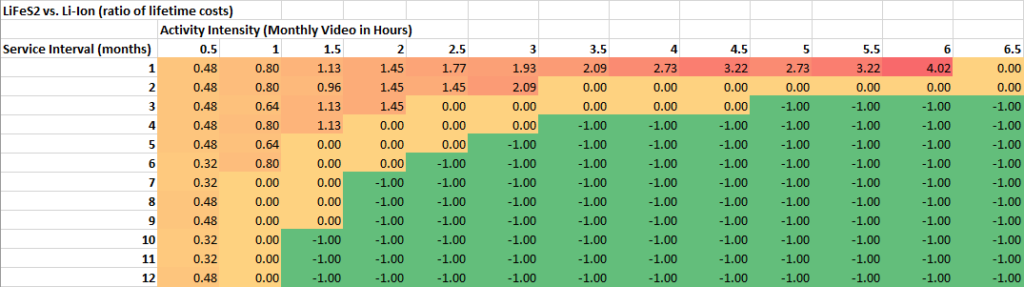
In the two plots below, I summarize the results of this model by showing regions in the space of Activity Intensity (Monthly Hours of Video) and Service Interval (in months).
For example, in the first plot below comparing LiFeS2 primary and Li-ion rechargeable AA cells, green areas (e.g. 6 hours of video per month, and a service interval of 10 months) are where neither battery type can supply the necessary energy. Yellow areas (e.g. 4 hours of video per month, and a service interval of 3 months) are where only the primary LiFeS2 battery can supply the necessary energy. Yellow-Red areas indicate areas where LiFeS2 cells are less expensive than the rechargeable Li-ion cells (more yellow), or vice versa (red).
Broadly speaking, we can see that for low activity intensity (< 1.5 hours of video/month) and long service intervals (7 months or more), LiFeS2 batteries are more cost effective over 5 years because the of their increased capacity, and relatively lower cost. In contrast, for sets with activity more than 1.5 hours of video per month and which are serviced frequently (at least every one to three months), the Li-ion cells an be up to 4 times lower cost due to their ability to recharge. This despite the fact they cost nearly 10 times as much per new battery.
Model Results: Alkaline vs. NiMH
Below is a 2nd plot with similar structure focused on Alkaline vs. NiMH cells. The trends are similar, but due to the lower up-front cost of the NiMH cells, they can be more cost effective even with lower activity rates — e.g. of greater than 1 hours of video per month.

Model Source
I have posted a public version of my spreadsheet model on my github site.
References
- Energizer L91 Ultimate Lithium Product Data Sheet
- Energizer Cylindrical Primary Lithium Handbook and Application Manual
- Energizer E91 (Alkaline) Product Data Sheet
- Energizer Alkaline Handbook
- Energizer NH15-2300 (HR6) Product Data Sheet
- Panasonic Eneloop Product Guide
- Panasonic Batteries NiMH Handbook
- Tenavolt (Li-ion AA battery) Website
- OPUS BT-C2400 Battery Charger Analyzer Tester for AA/AAA Batteries: Low cost battery tester I used to measure the capacity of NiMH and Li-ion AA cells at a number of temperature/discharge rate operating points. Works in a refrigerator and freezer. I have not tested at higher temperatures (summer passed this season in New England before I could get a measurement).
- Review and Teardown: Tenavolt AA Size 1.5V Li-ion battery: well-done YouTube video featuring quantitative room temperature discharge at 500 mA, as well as a mechanical teardown of a battery (requiring a grinding wheel to open metal case). Exposes internal 13430 Li-ion battery, as well as integrated power converter. I agree with the author that the “vendor is pretty honest” in listing the capacity of this cell as 2.775 Wh. The author measured a usable energy of only 2.475 Wh, but my measurements (espeically at higher loads) were much closer 2.7 Wh .
Great study! Would I be able to get a copy of the excel? We’re doing a multi-year large scale beaver monitoring study for a non profit with very little budget and trying to determine what is most cost effective. I’d like to edit the inputs based on current pricing, etc.
Absolutely! Just sent you a copy of the spreadsheet. Let me know how it works for you. Good luck with your project!
Updated this post to document recent early failure of a TenaVolts Li-ion AA cell.